It can be really hard getting a handle on what factors affect your customers’ decisions, or how to get buy-in from your stakeholders. The Decision Factors sketch can make it easier.
Think of the last time you made a big purchase. What was that like for you? Did you weigh up pros and cons? Was anyone else involved in the decision with you? Was there a mix of objective factors and emotional factors?
A lot can go into making a decision. Why do we buy the products and services we buy? Why do we choose one brand over another? Why do some factors influence us more than others? Or why is it so hard to get teams to use a new system, as part of change management?
If you’re a researcher, designer, marketing professional, product manager, or change manager, you probably spend a lot of your time thinking about these sorts of questions. There’s an incredibly rich and complicated soup of factors and biases going on in the way we make decisions, large and small, as well as various forces that play on those factors and biases. There’s also a huge body of ongoing research into the cognitive psychology and behavioural economics involved in decision-making.
I want to show you a simple framework that has helped me apply the essence of this research: the Decision Factors sketch. It helps you visualise the various factors going on as we make decisions for behaviour change, whether that change is to make a purchase, to join a meeting, to approve a design… anything at all.
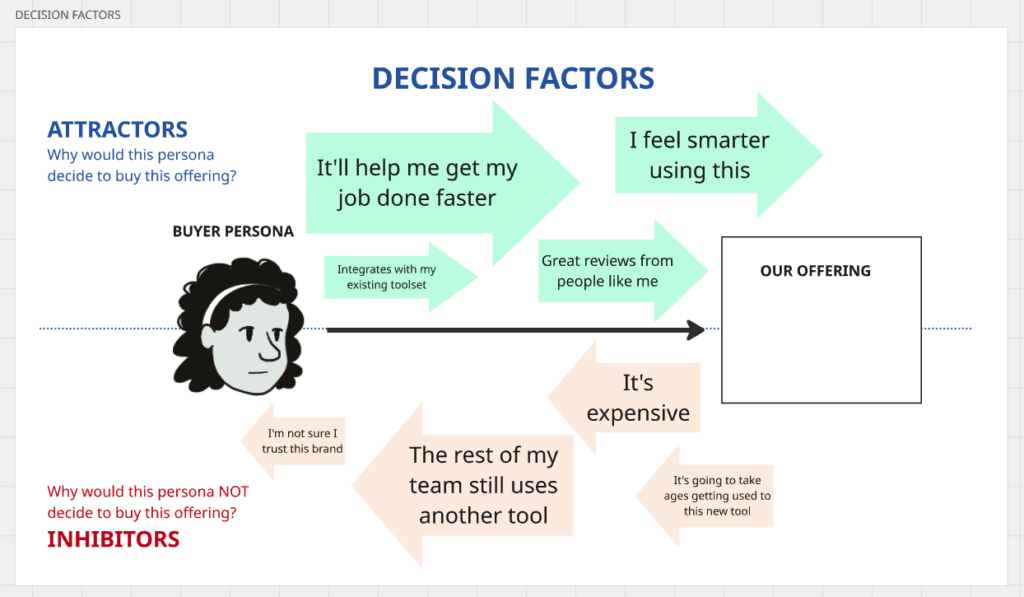
What’s in the Decision Factors sketch?
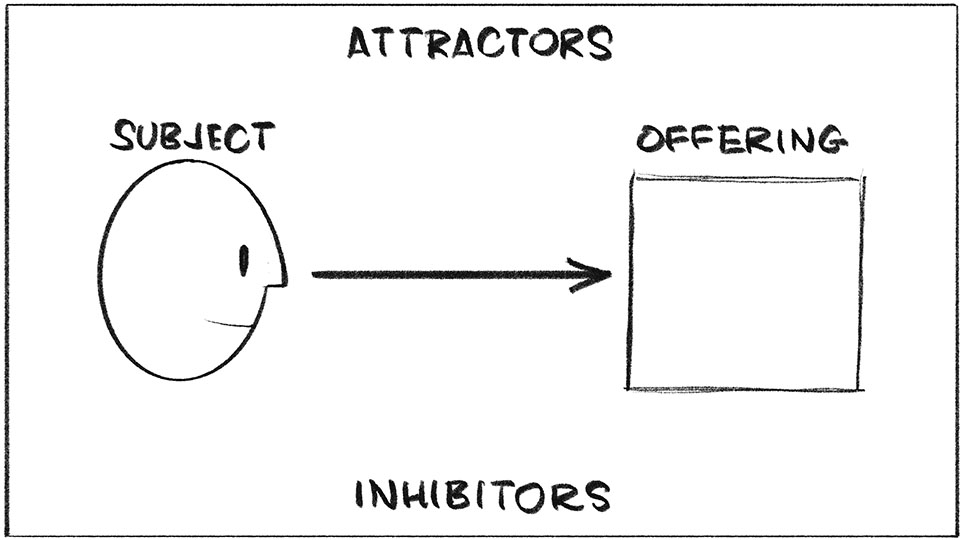
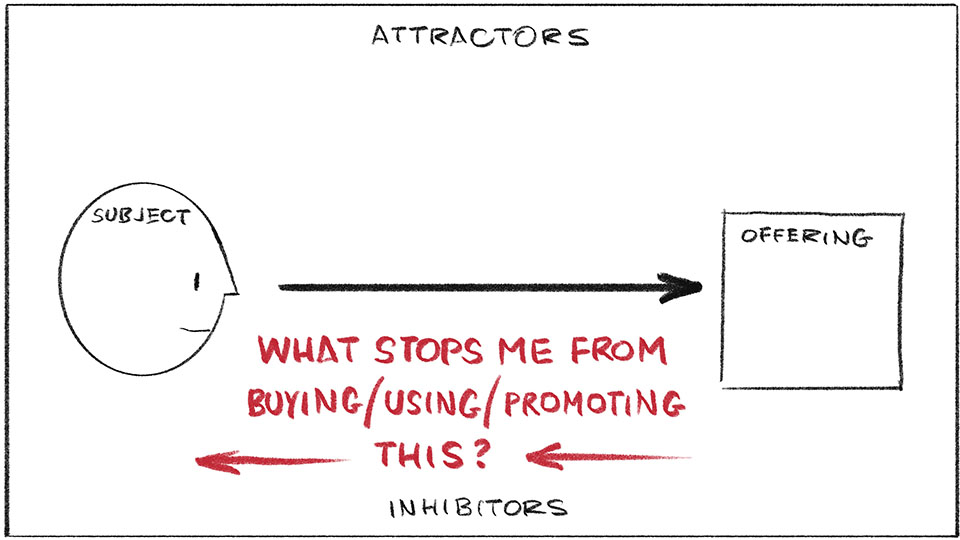
As you can see in the sketch above, there are four main elements going on:
- SUBJECT – Your customer, persona, stakeholder, staff-member… the person who you want to make a decision for change
- OFFERING – The thing (idea, solution, product, proposal) that you want the subject to buy, or buy into
- ATTRACTORS – The factors that attract this person to your offering
- INHIBITORS – The factors that inhibit, distract, or otherwise prevent this person from making the decision to buy/buy into your offering
By mapping out the factors in this way, you can really put yourself into the mind and shoes of that person, spot gaps in your understanding, and enrich your own thinking about the relationship between your offering and your customers/stakeholders. Let’s take a closer look…
Attractors
By using this sketch to list out the factors that encourage someone to make a decision in favour of your offering, you pull the focus of the offering from its features (usually what we think about the most) to what those features are for.
These tend to do with things like:
- GOAL – What would this person achieve with your offering? This is the main factor that everyone thinks about, and is at the foundation of user-centred design and jobs-to-be-done theory. A decision cannot take place without the recognition of a need of some sort, to help solve their specific problem.
- OBJECTIVE BENEFITS – What is better about your offering than the competition, or what the person is doing already? You should be able to list some differences your offering affords them, e.g. to do some task easier/ faster/ cheaper, to do better, gain more, save more.
- SUBJECTIVE BENEFITS – What emotional need lies on the other side of the goal (above)? This is the factor we like to think drives everyone else except us… but we know that’s not really true. This is the factor at play in marketing messages and advertising. These are the ’emotional jobs’ in JTBD theory. Things like: make me look good in front of others, make me more popular, make me feel smarter/ sexier/ cooler/ more powerful. Make me more…complete.
- TRUST – How much would the person rely on your offering? Past experience of something is our best predictor of the future performance of something similar. The trust earned from a previous positive experience is a strong attractor in itself.
Inhibitors
Inhibitors are the forces that turn us off, hold us back, or get in the way of deciding to buy or change. Often I find that teams ignore these, but defining them and mapping them can be super insightful.
Inhibitors can include things like:
- HABIT – People’s habits — their regular entrenched way of thinking and/or doing things — can be a powerful thing to have to overcome.
- OBJECTIVE DRAWBACKS – There may well be specific disadvantages that are worth highlighting in the array of factors affecting the person, such as increased cost of time and resources. But sometimes behind these objective drawbacks, lie factors that actually affect that person more…
- SUBJECTIVE DRAWBACKS – These factors don’t apply to all buying or behaviour change decisions of course, but they can still be powerful deterrents. What might the person be afraid of, if they decide to do/buy/use your offering? Is there a fear of change? Fear of loss of control? Or any limiting beliefs in the way, e.g. “I don’t know if I actually deserve this”, “I’m not worthy of it”, “It’s out of my reach”…?
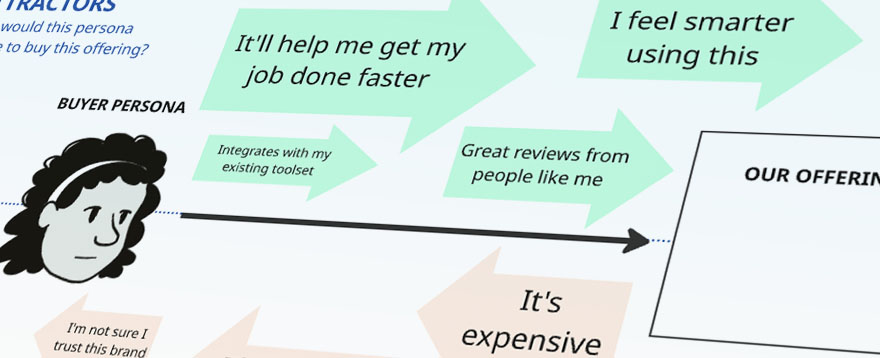
Visualise the factors at play with different-sized arrows
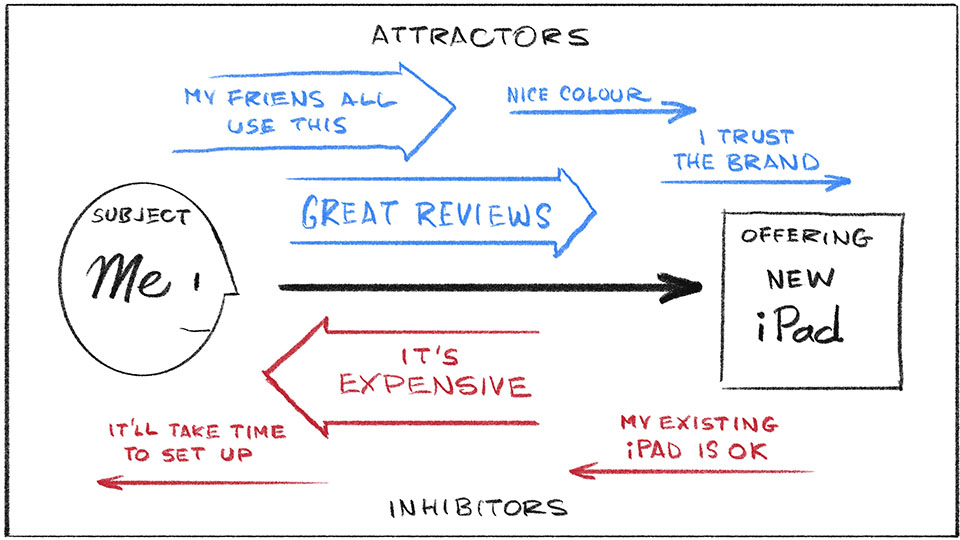
I hope you can see that the Decision Factors sketch is more than just listing pros and cons for the subject. This is a visual, so we can map how big/small each of the factors are, with different-sized arrows. This helps you (and others you show it to) understand how these various factors might work together, or counteract each other, more quickly, accurately, and comprehensively.
Here’s a simple example (below), of the factors involved in me thinking about replacing my existing iPad with a brand new one:
What do I use the Decision Factors sketch for?
You can use this to:
- Help explore how to make your product/service more desirable to your customers
- Help analyse research results about customers’ needs and buying habits
- Help dig into why people are/aren’t adopting a new product/service/way of doing things in your organisation
- Help yourself prepare for a pitch to stakeholders, to attune your communications to what they care about the most
- Have a more productive discussion in any 1:1s with staff or stakeholders
How do I do the Decision Factors sketch?
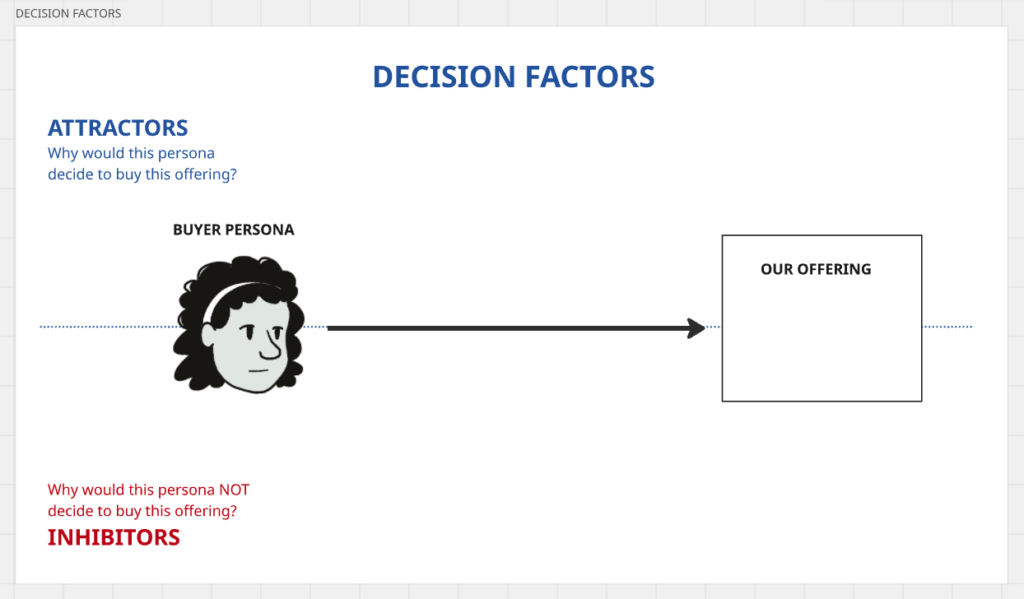
1. Draw up the framework
Start by drawing the basic framework of the Decision Factors sketch on a whiteboard, flipchart, or even just a piece of office paper. You can even put these elements together in an online collaboration space like Miro or Mural. The example images below all come from Miro (and uses a head drawing for the buyer persona from my Storyboarding Toolkit).
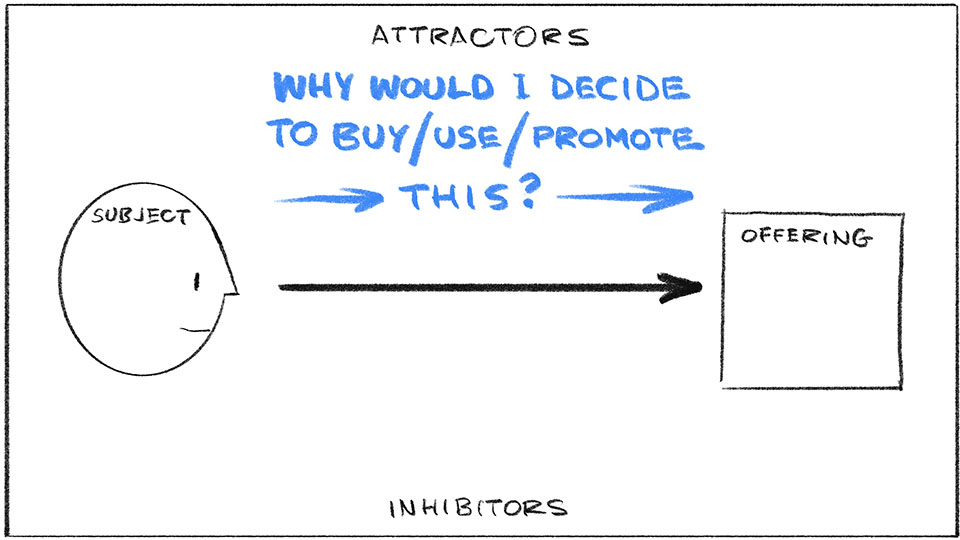
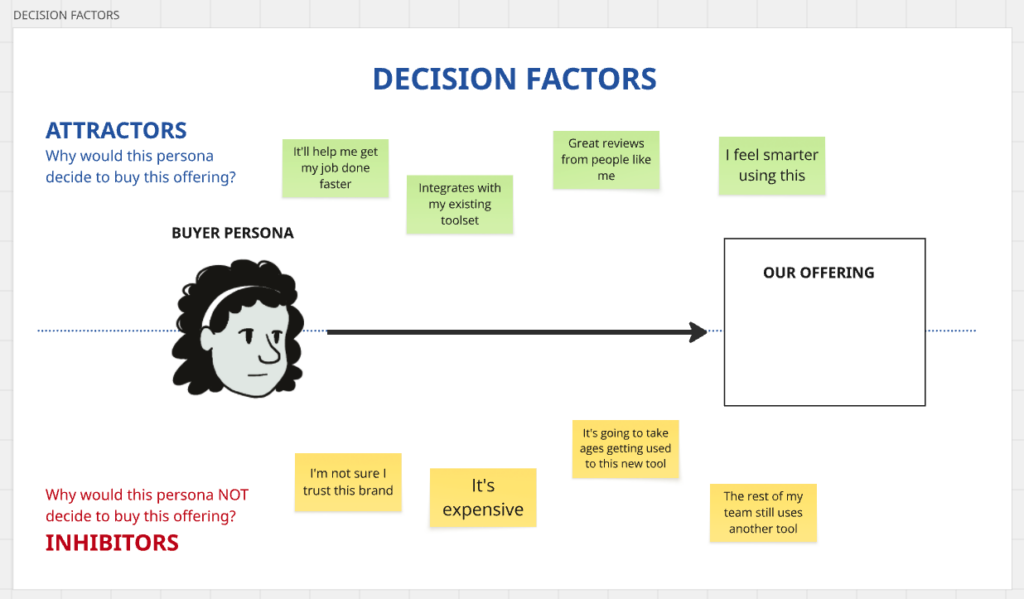
2. Add your ideas for the different factors involved in the decision
Now, you and your group can ideas above and below the main decision arrow, all with the aim of gaining a deeper understanding of how to maximise the likelihood of a particular subject deciding to buy/use/support your offering. You can ask yourself or your group questions like:
- What’s in it for this person to buy/use our offering / solution?
- What is holding them back from buying it/using it?
- What might distract them from making this decision?
Capture what you’re thinking, or what others are saying, on the sketch as you go, and draw an arrow going forward or backward, to signify the attractors and inhibitors. Messy is totally OK; this is definitely a case where the process of using this sketch is often better than the final product.
Note! You don’t have to solve anything right now. Resist the temptation to justify your offering, or falsely ‘jack up’ the power of some attractors over others, or to rationalise any of the inhibitors away.
3. Add and compare sizes to each of the factors
Once you have a range of ideas above and below the main arrow, try to play with the size of the forward and backward arrows (or the size of the sticky notes if you’re using an online collaboration space), to indicate what factors are greater than others, or what factors you know you need to focus on. This can also expose some blind spots that you or your group might not have thought about.
4. Discuss next actions
Once you or your group have laid out and assessed the array of various attractors and inhibitors, now you can switch to ‘solution mode’, and think about what you need to do, to increase the chances of this person adopting your offering.
- Is there something about your offering that needs to be introduced? Or dialled up? Or taken out?
- Is there a benefit of your offering that just isn’t clear enough?
- How might you change any marketing or communications to help people decide?
- Are there any specific messages you need to put out there, to help people deal with the inhibitors?
- Is there something you can do to help with a specific inhibitor, that would tip the balance in your offering’s direction?
Try it yourself
As I hope you can see, the Decision Factors sketch can be a powerful visual analysis and re-framing device. It can be fast and light – like using it right before you go into a pitching presentation – or it can be thorough and in-depth, like in a product strategy workshop.
However you use it, I hope it brings you might insight and success!